
Performance & Optimization
By monitoring container performance metrics like CPU, memory, and network usage, you can identify and troubleshoot issues before they impact users.
Requirements
- Docker: Container management
- Prometheus: Scrapes metrics
- Node Exporter: Export metrics
- Grafana: Build dashboards for monitoring
Folder Structure
A well-defined structure promotes modularity. Each service or component can reside in its directory, encapsulating its configuration files, Dockerfile, and related scripts.
#! bin\bash

echo "Creating Folder Structure"

mkdir -p grafana
mkdir -p prometheus
mkdir -p node-exporter
touch /prometheus/prometheus.yml
touch /grafana/docker-compose.yml
touch /prometheus/docker-compose.yml

echo "Folder Structure Created"
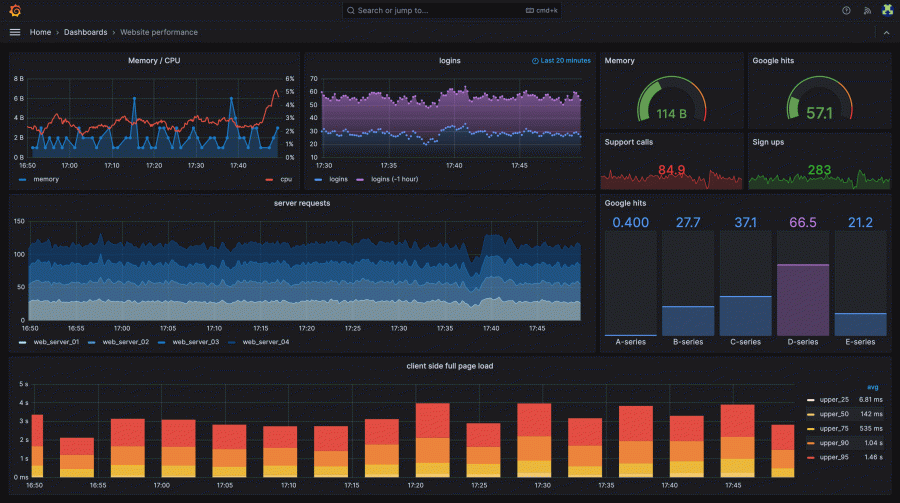
Grafana
Grafana empowers you to turn raw data into actionable insights. By providing a centralized platform for visualization, exploration, and alerting, it helps you make data-driven decisions and optimize your systems.
Here's how to spin up Grafana using docker-compose.
version: "3.8"
services:
  grafana:
    image: grafana/grafana
    container_name: grafana
    restart: unless-stopped # Ensure grafana runs even if docker restarts
    ports:
     - '3000:3000'  # Allows to access UI in port 3000.
    volumes:  # Without defined volumes data will be lost when volume restarts.
      - grafana-storage:/var/lib/grafana # Mounts a local directory (grafana-storage) to
# a directory(var/lib/grafana) inside the container.
volumes:
  grafana-storage: {}
Prometheus
Prometheus provides a robust and efficient solution for monitoring and alerting. Here's how to spin up Prometheus with a docker-compose file.
services:
  prometheus:
    image: prom/prometheus
    container_name: prometheus
    command: # Defines a command to be executed inside the container.
      - '--config.file=/etc/prometheus/prometheus.yml' # Tells prometheus to use the configuration file
# located at /etc/prometheus.yml
    ports:
      - 9090:9090
    restart: unless-stopped
    volumes:
      - ./prometheus:/etc/prometheus # Mounts the local directory we are to a directory inside the container.
# This allows to manage of configuration files in the container from the host.
      - prom_data:/prometheus  # Mounts a local directory to a container directory.
# This way Prometheus can save its time series data.
volumes:
  prom_data:
Prometheus.YML
Prometheus.yml is the configuration file that defines the core behavior of a Prometheus server. It dictates how Prometheus collects, stores, and processes metrics.
global:
  scrape_interval: 15s
  scrape_timeout: 10s
  evaluation_interval: 15s
alerting:
  alertmanagers:
    - static_configs:
      - targets: []
      scheme: http
      timeout: 10s
      api_version: v1
scrape_configs:
  - job_name: prometheus
    honor_timestamps: true # Instructs Prometheus to preserve the original timestamps of scraped metrics.
    scrape_interval: 15s
    scrape_timeout: 10s
    metrics_path: /metrics
    scheme: http
    static_configs:
      - targets:
        - localhost:9090
  - job_name: "node" # Scrape metrics from node-exporter
    static_configs:
      - targets: ["192.168.0.7:9100"]
Node Exporter
Node Exporter is a crucial component in the Prometheus ecosystem, primarily designed to collect and expose metrics about the underlying host machine.
It's essentially a bridge between your hardware and the powerful analysis capabilities of Prometheus.
services:
  node-exporter:
    image: prom/node-exporter: latest
    container_name: node-exporter
    restart: unless-stopped
    volumes:
      - /proc:/host/proc:ro # Mounts the local /proc directory to the containers /proc
# in read-only mode. So the container could read data from the proc.
      - /sys:/host/sys:ro
      - /:/rootfs:ro # Mounts the entire file system in read-only mode.
    command:
      - '--path.procfs=/host/proc' # Tells the container where to look for the proc directory.
      - '--path.rootfs=/rootfs'
      - '--path.sysfs=/host/sys'
      - '--collector.filesystem.mount-points-exclude=^/(sys|proc|dev|host|etc)($$|/)' # Excludes mount points from
# collection.
    ports:
      - 9100:9100
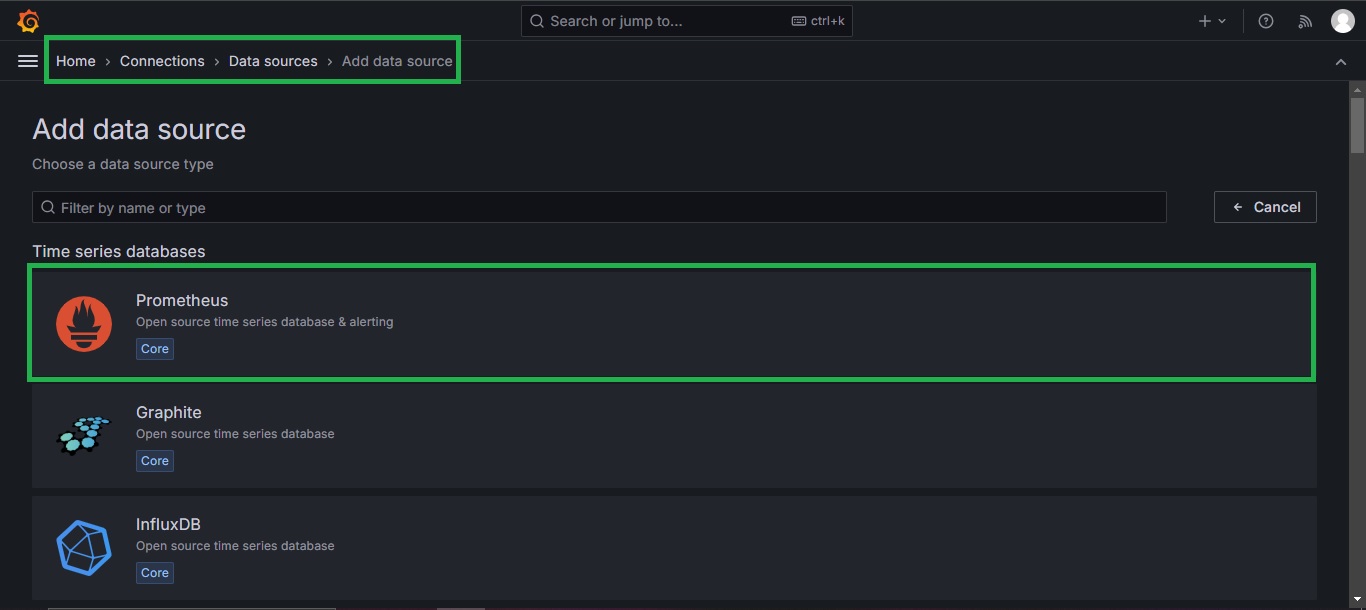
Grafana: Data Sources
Once logged in to Grafana by browsing to your-container-ip-addres:grafana-port Prometheus can be added as a data source by navigating to Home > Connections > Data Sorces > Add Data Source.
Then the URL where Prometheus is active must be provided. Usually your-container-ip-address: prometheus-port.
Importing a Dashboard
Importing a Dashboard is arguably the fastest way to get started with Grafana. To do that navigate to Home > Dashboards > New.

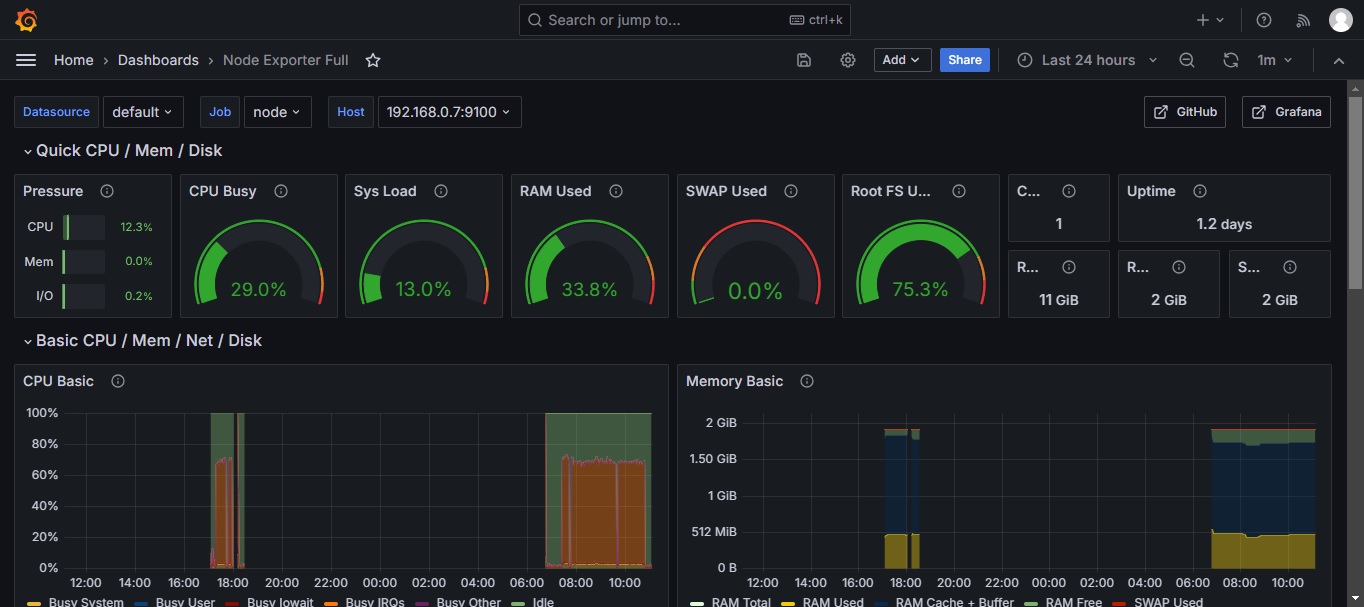
Node Exporter Full
By providing a starting point for system monitoring, the Node Exporter Full dashboard accelerates the process of gaining valuable insights from your infrastructure.
Next
Deploying a web application with Kubernetes. How to deploy a multi-tier app with Kubernetes.